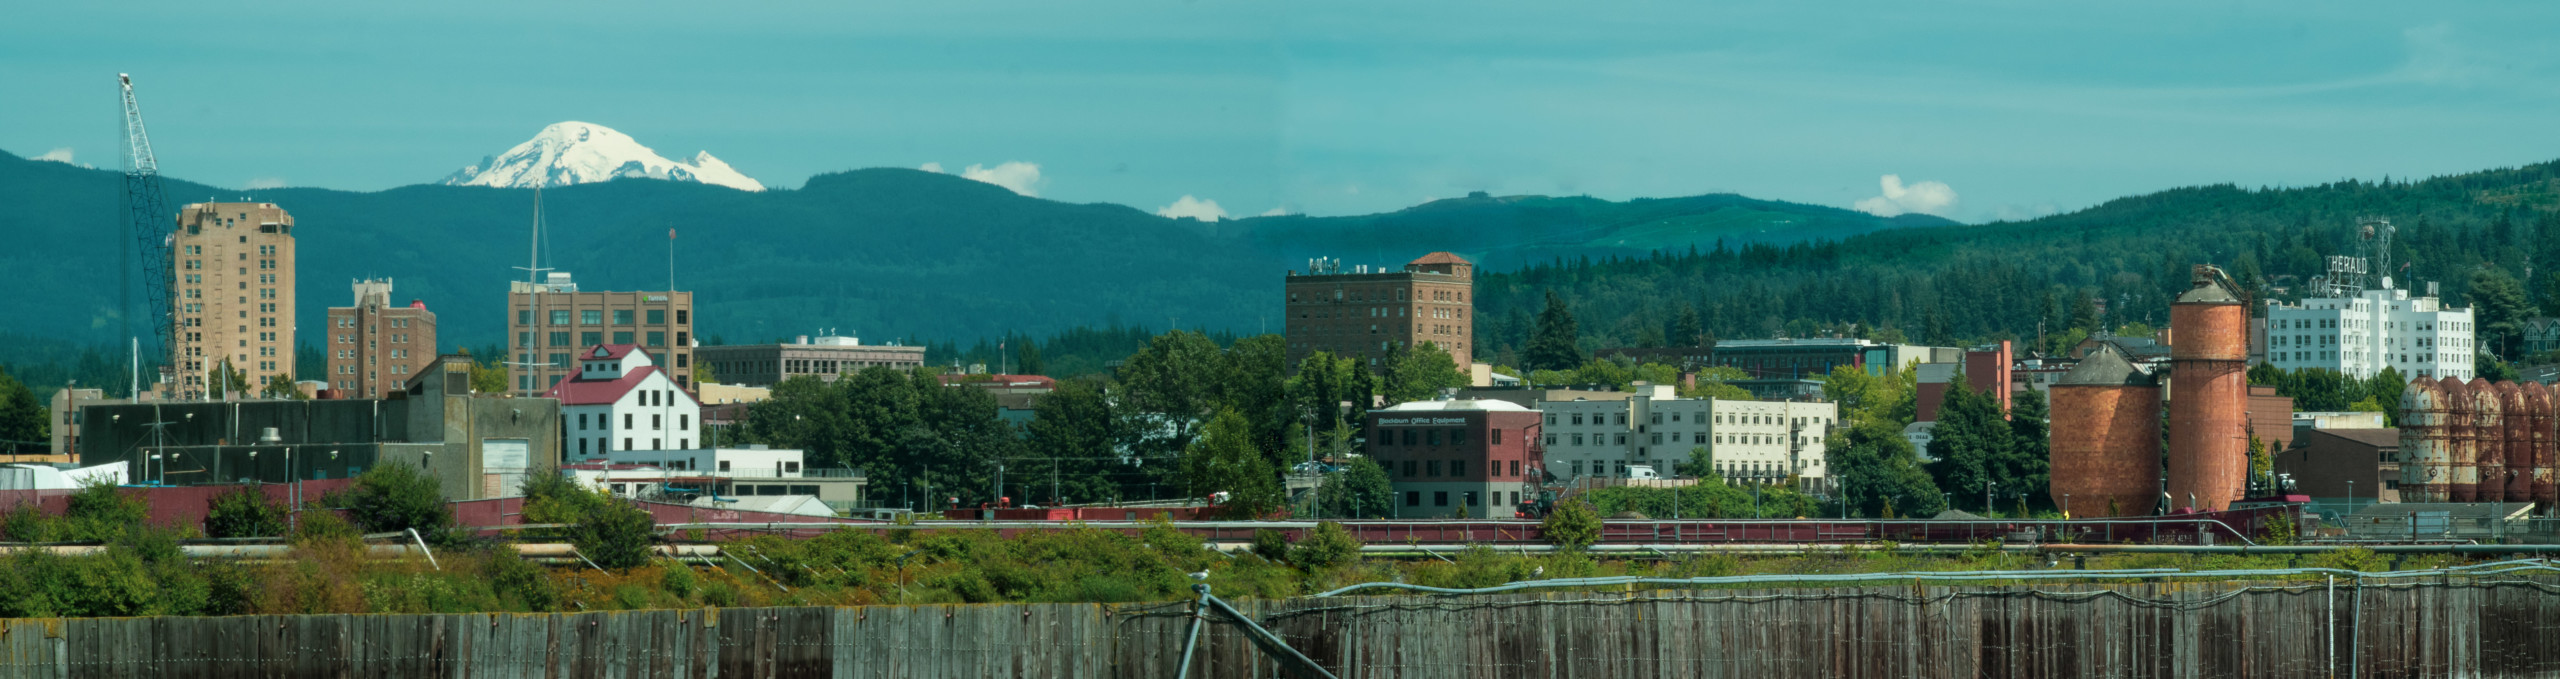
Bellingham Commercial Real Estate Information
Bellingham is the largest market for commercial real estate, north of Snohomish County. For retail and office space there are four major areas located within the City of Bellingham: Downtown, Cordata, Sunset, and Fairhaven. For industrial space, the primary locations in Bellingham are the Irongate Industrial Area and the Cordata Business Industrial Park.
Infrastructure for the Bellingham Commercial Real Estate Market
Bellingham has a robust infrastructure available to businesses. Bellingham features an international airport, deepwater marine port, railway system, and fiber optic internet. The Bellingham International Airport provides commercial flights, business services including air cargo, and US Customs. The BNSF railway runs north to south through Whatcom County and provides rail service throughout North America.
Featured Commercial Real Estate Listings in Bellingham WA
Iowa Business Park
1700 Iowa St, Bellingham, WA 98229, USA- Available SQ. FT. n/a
- Building SQ. FT. 31,457
- Cap Rate: 6.14%
- LOT SQ. FT. 140,263
- Year Built: 1977
- CBA #: 39406270
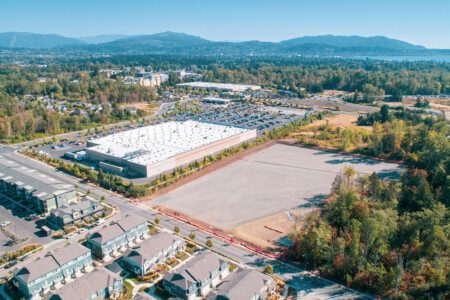
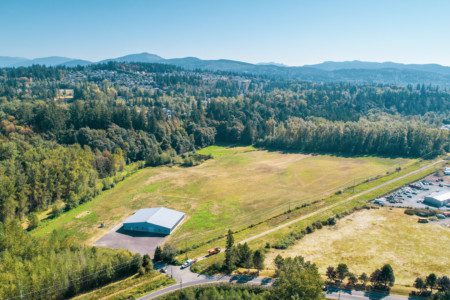
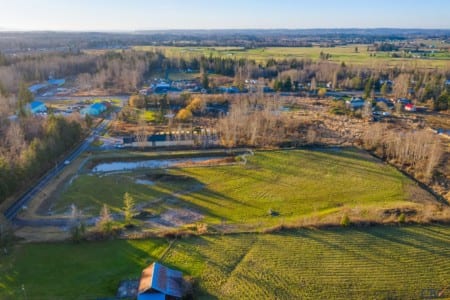
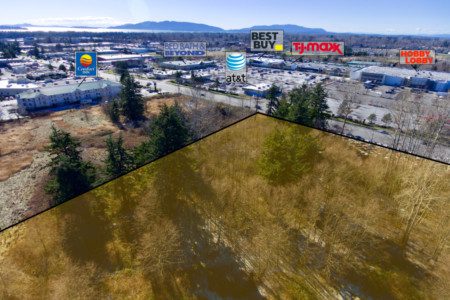
Planned Industrial Site
1365 Mahogany Ave, Bellingham, WA 98226, USA- Available SQ. FT. N/A
- Building SQ. FT. N/A
- Cap Rate: N/A
- LOT SQ. FT. 409,464
- Year Built: N/A
- CBA #: 34078290
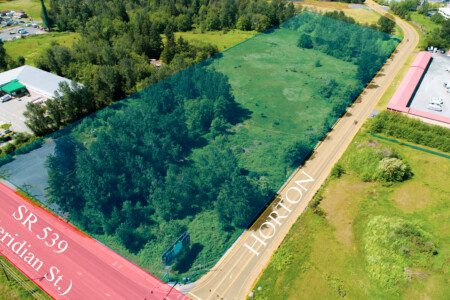
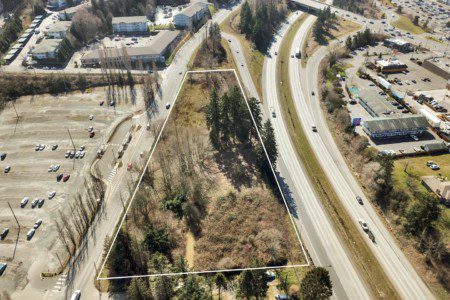
Guide Meridian Industrial Property
4577 Meridian St, Bellingham, WA 98226, USA- Available SQ. FT. n/a
- Building SQ. FT. n/a
- Cap Rate: n/a
- LOT SQ. FT. 594,158
- Year Built: n/a
- CBA #: 38277642
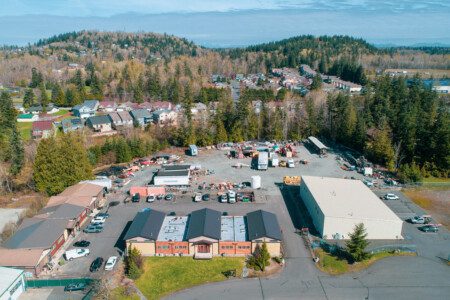
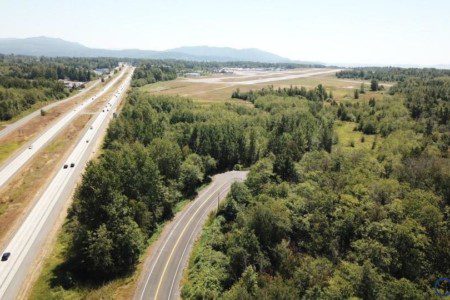
Irongate Industrial Pad
4053 Hammer Dr, Bellingham, WA 98226, USA- Available SQ. FT. 87,909
- Building SQ. FT. n/a
- Cap Rate: n/a
- LOT SQ. FT. 233,482
- Year Built: n/a
- CBA #: 40053053
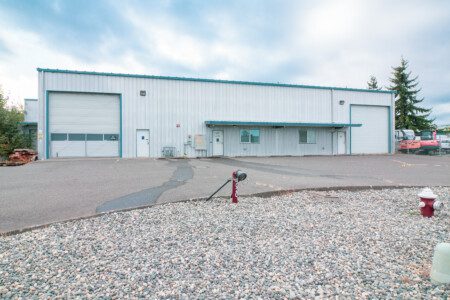
Irongate Planned Industrial
2881 E Bakerview Rd, Bellingham, WA 98226, USA- Available SQ. FT. n/a
- Building SQ. FT. 12,500
- Cap Rate: n/a
- LOT SQ. FT. 11,6305
- Year Built: 1996
- CBA #: 38918621
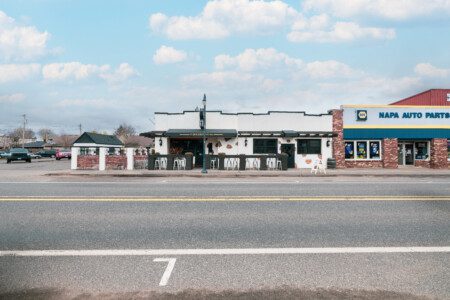
The Bourbon Bar & Grill
108 W Main St, Everson, WA 98247, USA- Available SQ. FT. 4,000
- Building SQ. FT. 4,000
- Cap Rate: 5.3%
- LOT SQ. FT. 4,356
- Year Built: 1900
- CBA #: 40160079
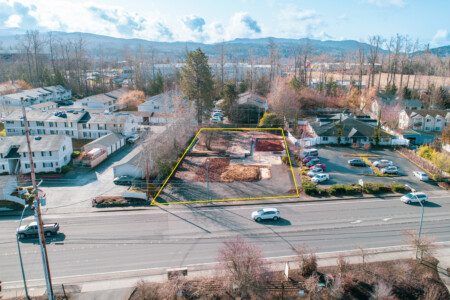
Sunset Drive Multifamily Development
2000 E Sunset Dr, Bellingham, WA 98226, USA- Available SQ. FT. 11,694
- Building SQ. FT. 11,694
- Cap Rate: 6%
- LOT SQ. FT. 20,037
- Year Built: n/a
- CBA #: 33986139

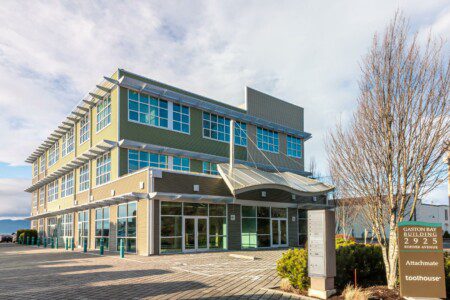
Gaston Bay
Gaston Bay Building, 2925 Roeder Ave, Bellingham, WA 98225, USA- Available SQ. FT. 5,495
- Building SQ. FT. 24,129
- Cap Rate: 6.4%
- LOT SQ. FT. 87,120
- Year Built: 1928
- CBA #: 601428
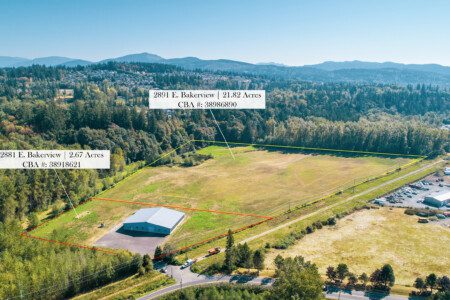
Irongate Industrial Land
2891 E Bakerview Rd, Bellingham, WA 98226, USA- Available SQ. FT. n/a
- Building SQ. FT. n/a
- Cap Rate: n/a
- LOT SQ. FT. 950,479
- Year Built: n/a
- CBA #: 38986890
Bellingham Commercial Real Estate Listings
Gaston Bay Building
2925, Roeder Ave, Bellingham, WA 98225- Available SQ. FT.
- Building SQ. FT. 24129
- Cap Rate:
- LOT SQ. FT. 87120
- Year Built: 1928
- CBA #: 601428
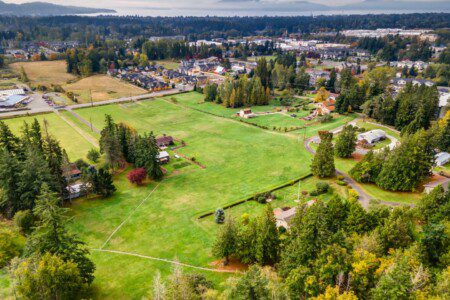
Kelly Road Business Park - Land
182, Kelly Rd, Bellingham, WA 98226- Available SQ. FT.
- Building SQ. FT.
- Cap Rate:
- LOT SQ. FT. 257875
- Year Built:
- CBA #: 572799
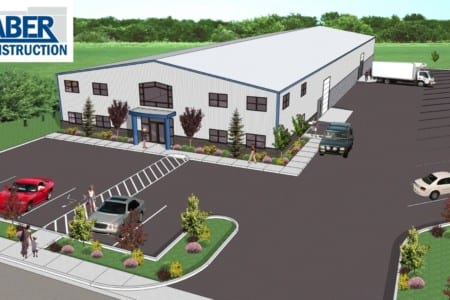
Kelly Road Business Park
188, Kelly Rd, Bellingham, WA 98226- Available SQ. FT.
- Building SQ. FT. 51000
- Cap Rate:
- LOT SQ. FT. 257875
- Year Built: 2015
- CBA #: 572798

2304 Michigan Street
2304, Michigan St, Bellingham, WA 98229- Available SQ. FT. 2416
- Building SQ. FT. 2416
- Cap Rate:
- LOT SQ. FT. 8276
- Year Built: 1989
- CBA #: 679666

3323 Northwest Avenue
3323, Ave, Bellingham, WA 98225- Available SQ. FT. 2349
- Building SQ. FT. 2349
- Cap Rate:
- LOT SQ. FT. 15907
- Year Built: 1937
- CBA #: 678526

200 E Stuart Road
200, Stuart Rd, Bellingham, WA 98226- Available SQ. FT. 116741
- Building SQ. FT.
- Cap Rate:
- LOT SQ. FT. 116741
- Year Built:
- CBA #: 676277
2891 E Bakerview Rd
2891, Bakerview Rd, Bellingham, WA 98226- Available SQ. FT.
- Building SQ. FT.
- Cap Rate:
- LOT SQ. FT. 950479
- Year Built:
- CBA #: 672155

1968 Midway Ln
1968, Midway Ln, Bellingham, WA 98226- Available SQ. FT.
- Building SQ. FT. 4800
- Cap Rate:
- LOT SQ. FT. 50103
- Year Built: 1990
- CBA #: 671936

Irongate Planned Industrial
2881, Bakerview Road, Bellingham, WA 98226- Available SQ. FT.
- Building SQ. FT. 12538
- Cap Rate:
- LOT SQ. FT. 378101
- Year Built: 1996
- CBA #: 671693

921 Lakeway Drive
921, Lakeway Dr, Bellingham, WA 98225- Available SQ. FT.
- Building SQ. FT. 3102
- Cap Rate:
- LOT SQ. FT. 4140
- Year Built:
- CBA #: 669496

331 Chuckanut Drive N
331, Chuckanut Dr, Bellingham, WA 98229- Available SQ. FT.
- Building SQ. FT.
- Cap Rate:
- LOT SQ. FT. 171191
- Year Built:
- CBA #: 667160
E Bakerview Rd
930, Bakerview Rd, Bellingham, WA 98226- Available SQ. FT.
- Building SQ. FT. 1248
- Cap Rate:
- LOT SQ. FT. 601564
- Year Built: 1957
- CBA #: 663684

Mixed Use Development Site
451, Bakerview Rd, Bellingham, WA 98226- Available SQ. FT.
- Building SQ. FT. 0
- Cap Rate:
- LOT SQ. FT. 98446
- Year Built: 0
- CBA #: 660512
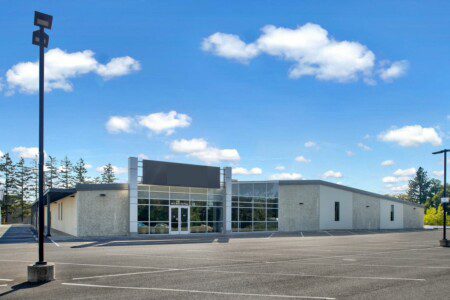
140 E Bellis Fair Pkwy
140, Bellis Fair Pkwy, Bellingham, WA 98226- Available SQ. FT. 27257
- Building SQ. FT. 27257
- Cap Rate:
- LOT SQ. FT. 103673
- Year Built: 1971
- CBA #: 657987
3816 Consolidation Avenue
3816, Consolidation Ave, Bellingham, WA 98229- Available SQ. FT.
- Building SQ. FT. 0
- Cap Rate:
- LOT SQ. FT. 112820
- Year Built:
- CBA #: 640007
Guide Meridian Frontage
4346, Guide Meridian, Bellingham, WA 98226- Available SQ. FT.
- Building SQ. FT. 0
- Cap Rate:
- LOT SQ. FT. 398138
- Year Built:
- CBA #: 638726
Kope Road Mitigation Site
1075, Kope Rd, Bellingham, WA 98248- Available SQ. FT.
- Building SQ. FT. 0
- Cap Rate:
- LOT SQ. FT. 542748
- Year Built:
- CBA #: 636994
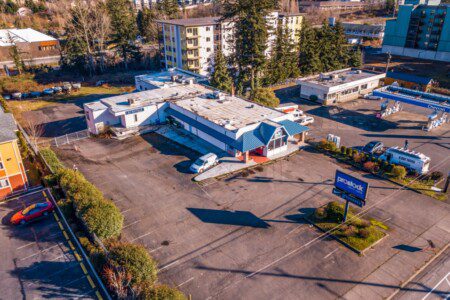
110 N Samish Way
110, Samish Way, Bellingham, WA 98225- Available SQ. FT.
- Building SQ. FT. 16000
- Cap Rate: 5.75
- LOT SQ. FT. 46660
- Year Built: 1972
- CBA #: 636770
44XX Pacific Highway
0, Pacific Highway, Bellingham, WA 98226- Available SQ. FT. 1524600
- Building SQ. FT.
- Cap Rate:
- LOT SQ. FT. 1577589
- Year Built:
- CBA #: 625585

1210 Mahogany Ave
1210, Mahogany Ave, Bellingham, WA 98226- Available SQ. FT. 113692
- Building SQ. FT.
- Cap Rate:
- LOT SQ. FT. 106801
- Year Built:
- CBA #: 680475
Bellingham WA
Listing Search
Bellingham Primary Trade Area (population 237,347)
Bellingham’s primary trade area serves a population of 237,347, which includes Bellingham’s city population of 96,014 (2021) and an addition population of 141,333 Whatcom County residents based on natural barriers and a lack of retail options.
Bellingham Secondary Trade Area (population 550,000)
The secondary trade area of Bellingham serves a population of 550,000 which includes the lower mainland of British Columbia including Vancouver, Richmond, Surrey, and Abbotsford as well as a population of 131,945 (2021) from Skagit Valley. Canadian retail tourism is strong in Bellingham’s trade area with over 12,000,000 passengers crossing the border from Canada into Bellingham in 2019. Current data on border crossings is bleak as the border was closed for most of 2020 and very limited in 2021.
Retail, Office, and Industrial Market Statistics
One of the best ways for a business or investor to determine what direction the market is headed is by looking at where the market has been. At Pacific Continental Realty, we track market statistics in Bellingham and the surrounding markets to keep us up to date with the market and so we can help educate you to make informed decisions. Currently, we produce a quarterly vacancy report for retail, office, and industrial in Bellingham.
Bellingham Retail Market Statistics (2021 YTD)
How much retail space exists within the Bellingham market? There are over 450 retail buildings and over 10,00,000 square feet. That may seem like a lot of retail space in a market the size of Bellingham, but with a 2021 vacancy rate of 3.89% it may not be enough. The retail market in Bellingham can be heavily influenced by the Canadian dollar. When the Canadian dollar is on par with the US dollar, the retail market screams in Bellingham. Given historical data, the breaking point appears to be around $0.80 on the US dollar for when the Canadian retail influence begins to diminish and the Bellingham commercial real estate market begins to feel it.
Search the entire market for Bellingham retail space for lease.
Bellingham Office Market Statistics (2021 YTD)
The trends in office space usage has changed over the last decade. Office tenants are not only demanding more open space and different types of layouts than before, but they also want more flexibility with their lease. This change in treads has created many older styled offices to be less desirable and with new office tenants wanting shorter lease terms, this would appear to be perfect storm for a disaster, but the statistics suggest otherwise. The current vacancy rate for office space in Bellingham is only 3.8%, which is well down from the recent average of 10.2%.
Search the entire market for Bellingham office space for lease.
Bellingham Industrial Market Statistics (2021 YTD)
The industrial market in Bellingham remained steady in 2020. With demand still very strong for industrial and no new buildings adding to the supply, the vacancy rate declined slightly. Still remaining below 1%, the overall vacancy rate for industrial buildings is a critical issue for manufacturers or distributors looking to enter the Bellingham market. The average asking rent for industrial space in Bellingham decreased from $0.76/SF/MO in Q1 to $0.73/SF/MO in Q2. The industrial sector is one of the strongest in the market for Bellingham commercial real estate.
Search the entire market for Bellingham industrial space for lease.